What it addresses
Coursework often stops at a single algorithm example. This project strings Python fundamentals, classical machine learning and deep-learning detection into one path, with complete data, code and results at every stage.
2026 Summer Python Course Project Collection covering Python fundamentals, machine learning regression prediction, student behavior data analysis, and YOLO11n-based Rock Paper Scissors gesture recognition.
This page documents a course path from Python fundamentals to computer vision, in four stages: 14 syntax exercises, a random-forest regression on California housing prices, analysis of student digital-behaviour data, and a three-class gesture detector trained with YOLO11n. The gesture model reaches mAP50 0.940 on the validation set, and the page lists the dataset, training configuration and evaluation results for comparison.
Coursework often stops at a single algorithm example. This project strings Python fundamentals, classical machine learning and deep-learning detection into one path, with complete data, code and results at every stage.
Stage one covers 14 Python syntax exercises; stage two applies a random forest to regression on the California housing dataset; stage three analyses student digital-behaviour data and produces six chart types; stage four trains YOLO11n to detect rock, paper and scissors gestures.
Python is the primary language, with scikit-learn’s random forest for analysis and modelling. The vision stage uses YOLO11n at 2.58M parameters, trained on an RTX 5060.
The gesture model reaches mAP50 0.940 on the validation set; the page lists dataset size, augmentation and training configuration. Reproducing it requires the course code, the dependency environment and the model weights.
14 beginner exercises: comprehensive coverage of data types, control flow, functions, lists, dictionaries, and more.
Random Forest regression for California housing median price prediction, R² = 0.805. Verified that income and geographic location are key influencing factors.
Kaggle real-world dataset analyzing the impact of study time, screen time, etc. on CGPA, with multi-model comparison.
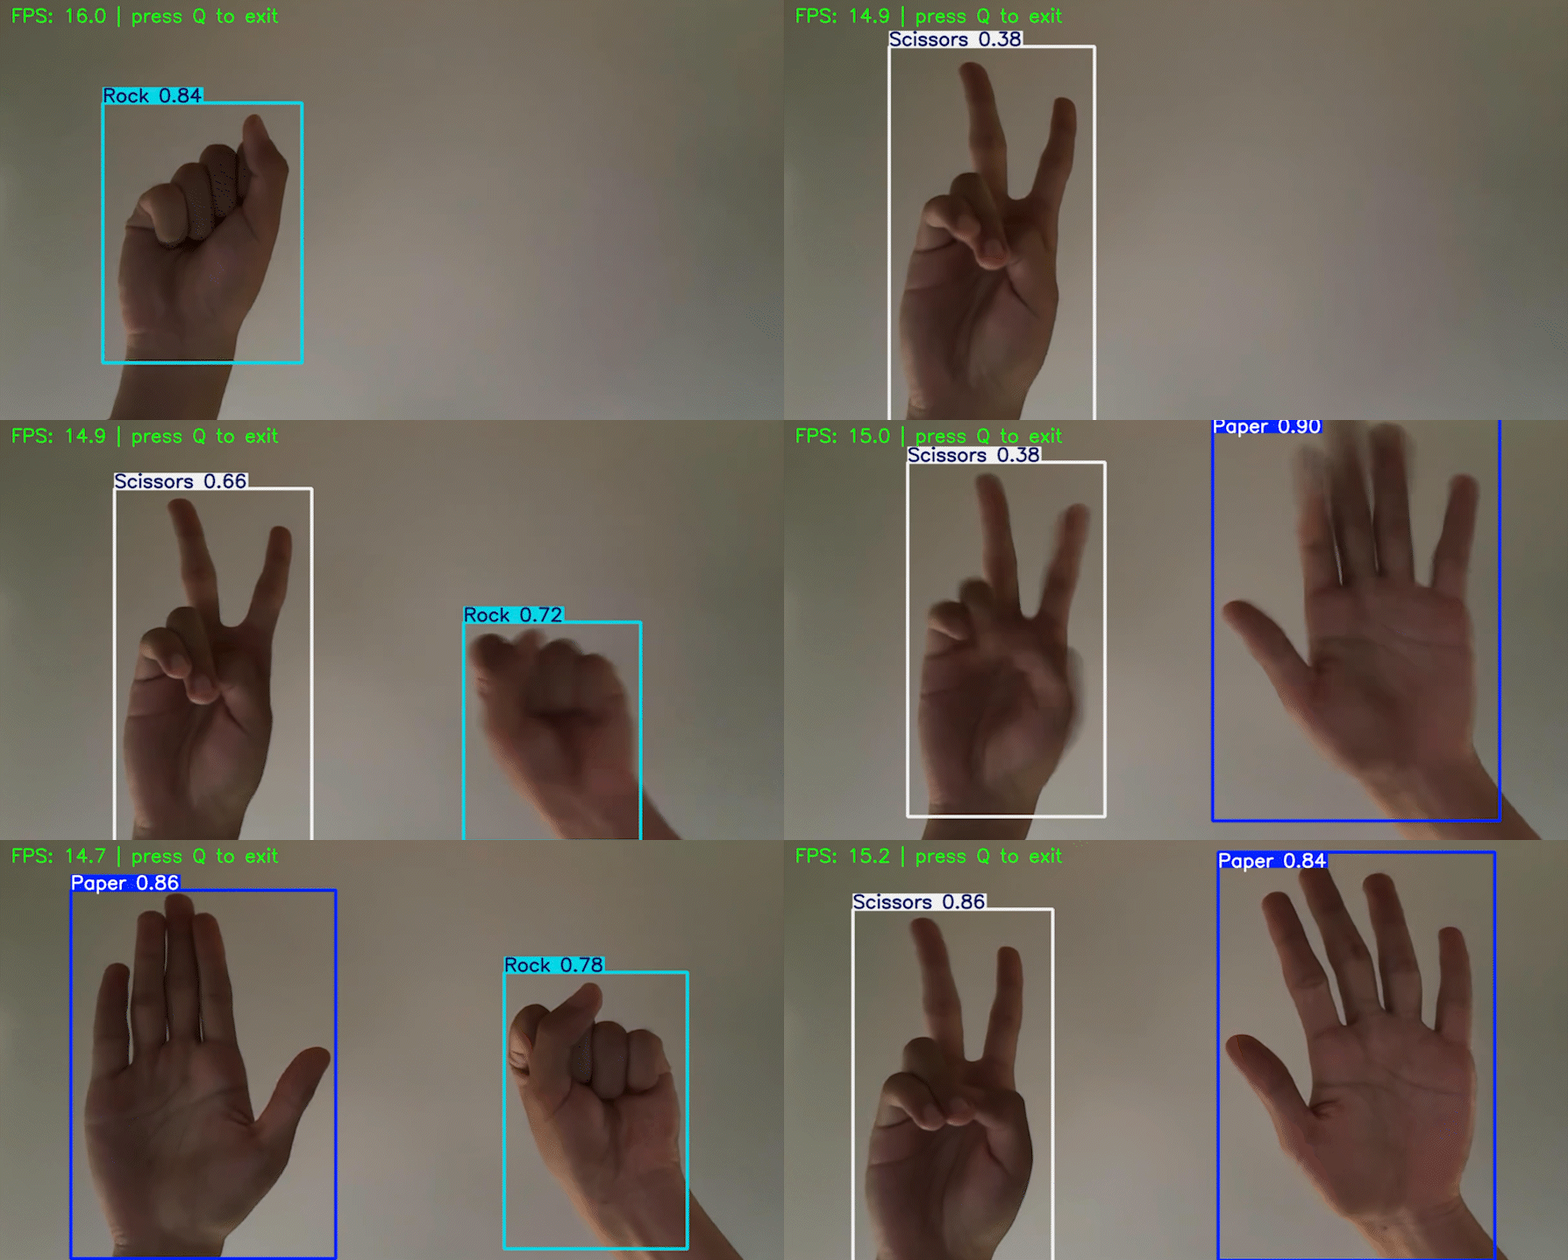
🪨📄✂️ Real-time detection of Rock/Paper/Scissors, validation set mAP50 = 0.940, millisecond-level inference.
Beginner-level Python programming exercises, zero third-party dependencies
1.1.py — Square of positive integer1.2.py — Formatted admission info output1.3.py — Right triangle hypotenuse length2.1.py — Euclidean distance between two points2.2.py — Sum of cubes of digits in a three-digit number2.3.py — Letter occurrence count (case-insensitive)3.1-3.2 — Grade level / Character type4.1-4.2 — Digit judgment / Factorial sum5.1-5.2 — Function encapsulation & math calculations6.1-6.2 — List comprehensions / Dictionary mappingscikit-learn · California Housing Dataset
California Housing — scikit-learn built-in dataset
MedInc (Median Income) > AveOccup (Average Occupancy) > Latitude / Longitude (Geographic Location) > HouseAge
Income level is the strongest predictor for housing prices; the importance of geographic location reflects regional housing price disparities across California.
Kaggle real-world dataset · Linear Regression vs Random Forest
Student Lifestyle and Academic Performance (Kaggle)
Right-skewed distribution; most students spend 3–8 hours on screens daily
Clear positive correlation; students studying 6–8h/day tend to have higher CGPA
Study Hours > Attendance > Screen Time
🪨📄✂️ Ultralytics · PyTorch · Object Detection
rock-paper-scissors-sxsw (Roboflow v11)
7 augmented versions generated per original image:
📄 Paper
🪨 Rock
✂️ Scissors
Recognize gestures from any photo; results are annotated with bounding boxes + labels and saved to the output directory.
Captures from system camera (1280×720) in real-time with millisecond-level per-frame inference; displays FPS in window, press Q to exit.
Validation set evaluation, test set evaluation, dataset download utility — full coverage from training to deployment pipeline.